Focusing on Palo Alto, Los Altos, Los Altos Hills, Menlo Park, Atherton, Woodside & Portola Valley
2020: The Year in Stanford Circle Real Estate
Pandemic, shelter in place, mass unemployment, terrible financial hardships for many households and small businesses, new ways of working, office buildings empty, people move, dreadful fires, an anxious presidential election, interest rates to historic lows, stock markets to new highs, IPO mania breaks out again, vaccines begin to arrive – and, after an initial crash in activity, the real estate market went into hyper-drive, with median home sales prices hitting new peaks. The luxury home market in particular was extremely strong. 2020: a year of extremes. There is a vast variety of homes within the region and within cities and how median sales prices apply to any particular property is unknown without a specific comparative market analysis. Median sales price is that price at which half the sales occurred for more and half for less. It is a very general statistic that often disguises a wide range of prices in the underlying individual sales. Median sales prices are often affected by factors besides changes in fair market value. Based upon sales reported to MLS – not all sales are reported. Data from sources deemed reliable, but may contain errors and subject to revision. All numbers are approximate. Late reported sales may alter numbers, though typically only to a slight degree.

Bay Area median house sales prices: Of larger regional markets, the Stanford Circle is by far the most expensive in the Bay Area.

A breakdown of house sales by home size:

A breakdown of house sales by lot size: Lot size often plays a significant role in home values in the region. Some of the most expensive communities are known for larger lot sizes.

Bay Area luxury home markets: Year-over-year summer sales volumes and percentage changes. Broken out as a separate market, the Stanford Circle of cities saw a substantial 43% Y-o-Y increase in sales, but some county markets, such as Sonoma, saw stupendous jumps. (Generally speaking, more rural markets have seen the largest increases in demand since the pandemic hit.)

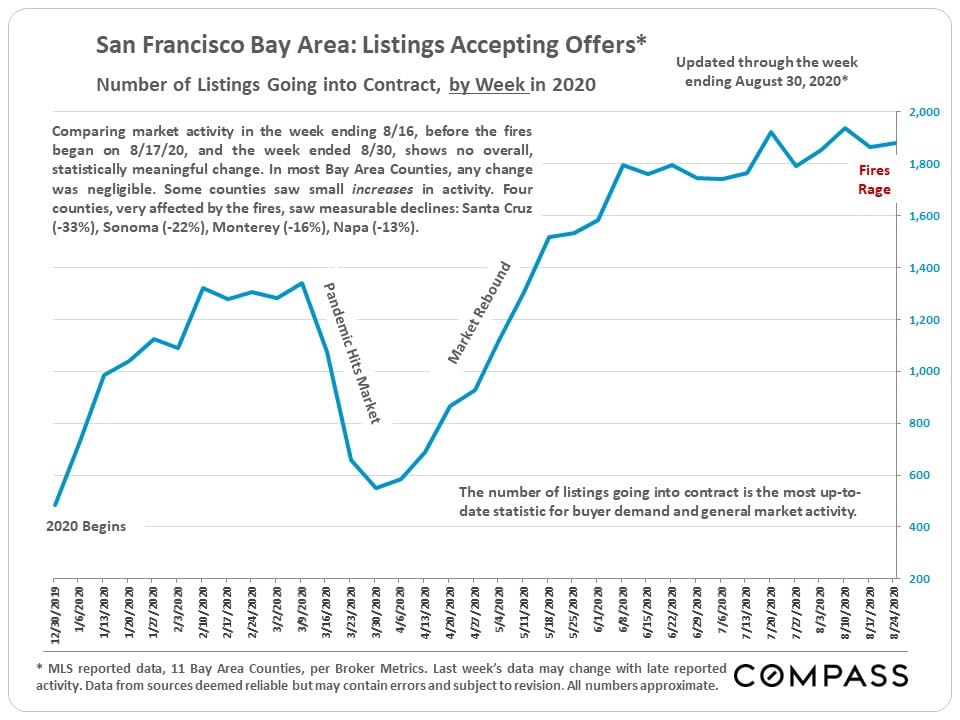
The next 3 charts look at year-over-year monthly trends in the numbers of active listings, listings accepting offers, and closed sales. Typically, spring is the very active season with a slowdown following in summer, but the pandemic changed that dynamic in 2020.


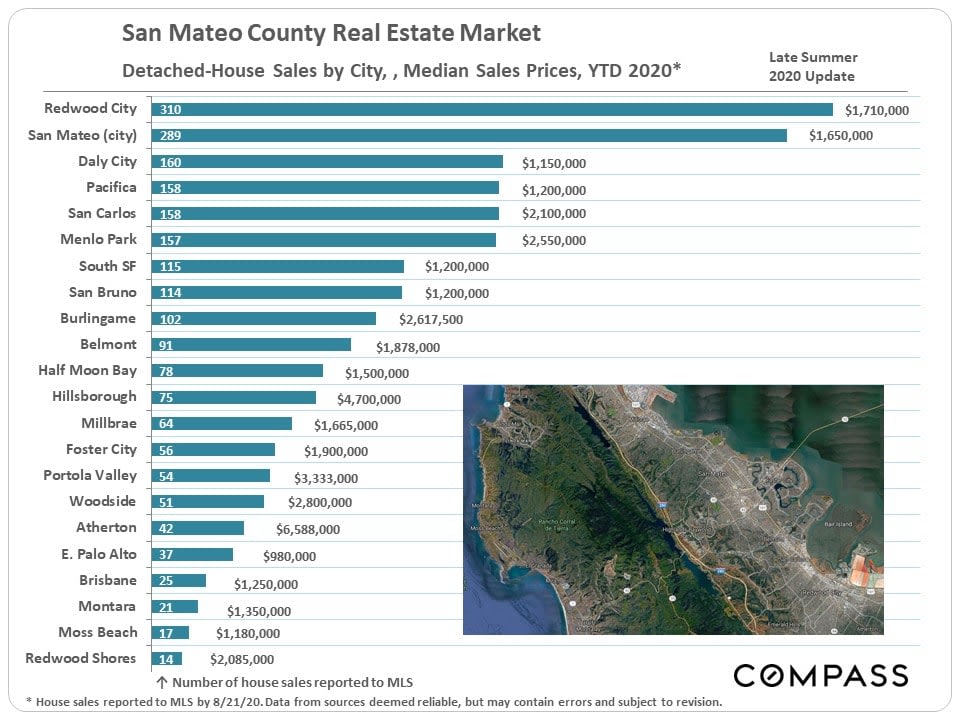
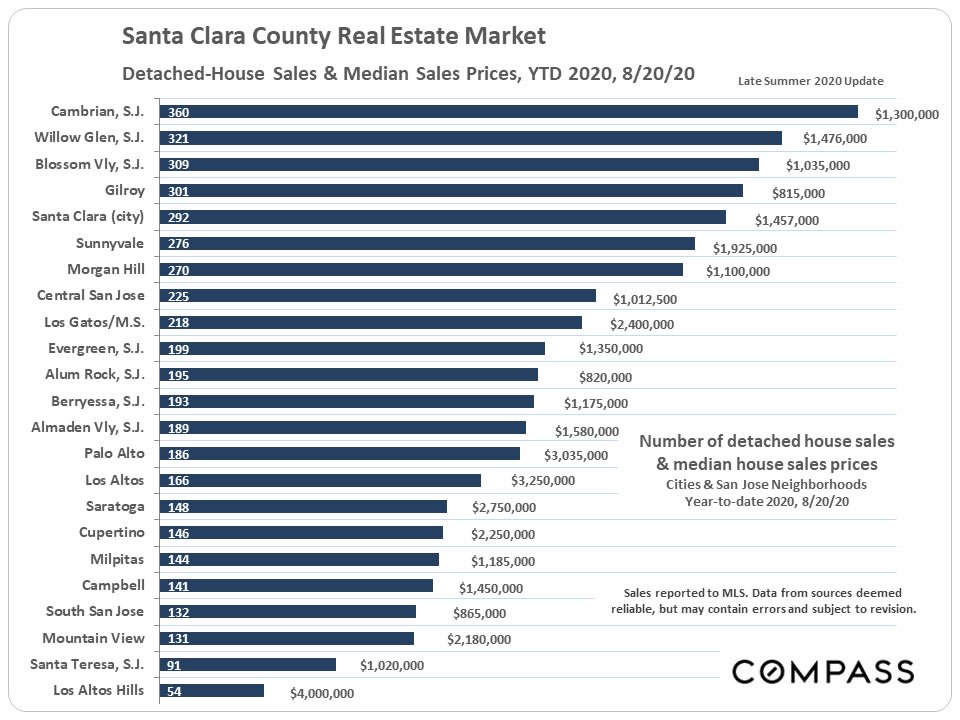
These final 2 charts put Stanford Circle cities into the greater peninsula/Silicon Valley context of their respective county markets.